IXI Data
Indexing Inclusion Ratio — Stock-Level Passive Ownership, 2000–2023
A monthly panel of realized passive ownership for U.S. equities, adjusted for Active Share. Constructed from FactSet fund-level holdings data, Morningstar benchmark assignments, and 460+ equity index constituents.
Total passive capital
$12.4T
Dec 2023, Active-Share adjusted
Avg. passive ownership
24%
Value-weighted mean IXI, 2023
Stocks covered
13,800+
CRSP common stocks, monthly
Sample period
2000–2023
1.29 M stock-month observations
Explore
Browse IXI by Stock
Select a stock to see its passive ownership profile. The family breakdown shows which index families drive the stock's IXI. Stocks included in more index families have lower concentration (HHI) and more diversified passive capital.
Loading stock data…
Aggregate Trend
The Rise of Passive Ownership
By 2023, roughly 1 in 4 dollars in the average U.S. stock is held by a passive investor, up from 1 in 30 in 2000. The value-weighted mean IXI rose from 2.7% to 24.0% over 24 years, driven almost entirely by capital flows into index funds and ETFs rather than active funds becoming more index-like.
Monthly cross-sectional mean IXI. Solid: value-weighted. Dashed: equal-weighted. Shaded band: interquartile range.
Benchmark Families
Where Does the Passive Money Come From?
Not all passive capital tracks the same index. The stacked area below shows each benchmark family's share of total passive dollar allocation over time.
S&P 500 dominates passive capital, but its share has fallen from 62% (2000) to 36% (2023) as total-market indices (CRSP, Russell) grow. The diversification of passive capital across index families has implications for price discovery and market stability.
Stock Spotlight
Tesla: A Case Study in Index Inclusion
Tesla's IXI was near-zero from its 2010 IPO through 2020, held primarily by active investors making deliberate bets. Each index inclusion triggered a mechanical inflow of passive capital, visible as a discrete jump. The S&P 500 addition in December 2020 was the largest: IXI doubled within months.

Three IXI variants for Tesla, 2010–2023. Solid: IXI (main, Active-Share adjusted). Dashed: IXIpass (pure passive funds only). Dotted: IXInon-adj (raw holdings, no adjustment; upper bound). The gap between the solid and dotted lines is the closet indexer correction. By 2023: IXI = 21%, IXInon-adj = 27%, a 30% overstatement without the adjustment.
Fund Landscape
The Barbell Effect: How Active Is Your Fund Manager?
The fund industry is polarizing into a barbell: funds are either fully passive or genuinely active, with the closet indexer middle (Active Share 5–40%) shrinking over time. Yet by assets under management, the picture is different: "mildly active" funds (Active Share 40–60%) still control a large share of total AUM despite being a small fraction of funds by count.
Distribution of U.S. equity mutual funds by Active Share category. While most funds are genuinely active, the closet indexer category (5–40% Active Share) has declined over time.
Key Findings
What the Data Shows
Cross-Section Shift, 2000–2023

The entire distribution of IXI shifted right over two decades. In 2000, most stocks had near-zero passive ownership. By 2023, the median stock has ~13% passive ownership.
Top 20 Most Passively Owned Stocks
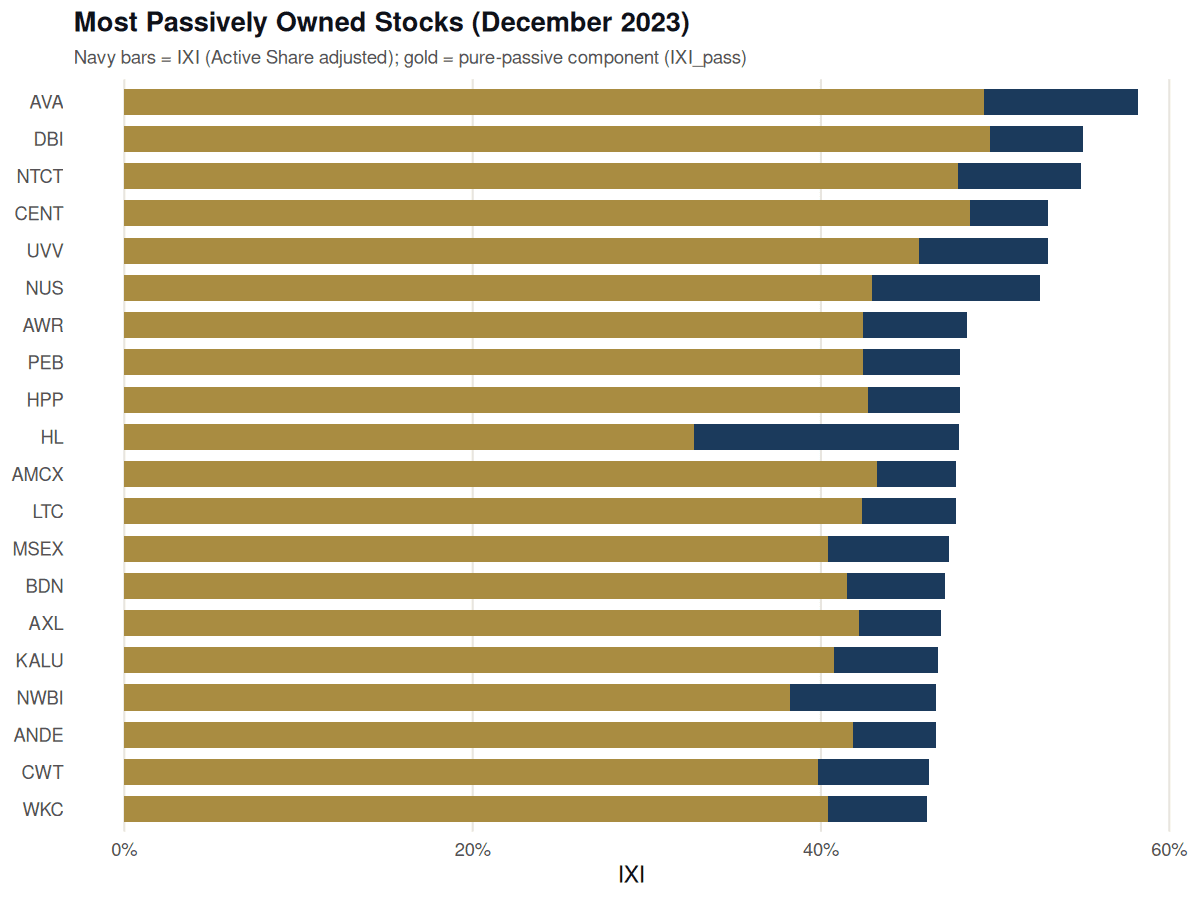
The highest-IXI stocks are not mega-caps like Apple or Microsoft. They are mid-cap utilities and REITs that appear simultaneously in dozens of sector, thematic, and size indices.
The Economic Consequence: Price Elasticity

Stocks with high IXI are ~40% less price-elastic than low-IXI stocks. Passive investors don't sell when prices rise; as their share grows, markets become less self-correcting.
Download
IXI Panel Data
Monthly stock-level IXI for the full U.S. equity cross-section, 2000–2023.
Columns (full panel)
| Column | Description |
|---|---|
permno | CRSP permanent stock identifier (numeric). The standard stock identifier in academic finance research. |
ticker | Stock ticker symbol (most recent for that PERMNO). |
company_name | Company name. |
year | Calendar year. |
month | Calendar month (1–12). |
date | First calendar day of the month (YYYY-MM-DD). |
IXI | Main measure. Passive ownership share, Active-Share adjusted across 460+ indices. A fund with Active Share 0.6 contributes only 40% of its holdings. Range 0–1. |
IXI_clean | IXI with alternate price denominator; robustness check, nearly identical to IXI for the vast majority of stocks. |
IXI_pass | Pure passive funds only (no Active Share adjustment needed; these are declared index funds). Stricter lower bound. NA for some observations. |
IXI_non_adj | Raw holdings, no Active Share adjustment; upper bound / naive count. Comparable to BMI (Pavlova & Sikorskaya 2023). NA for some observations. |
IXI_eq_full | Equal-index-weighted IXI scaled by book equity. Used as instrument in the demand system. Only populated at quarter-end months (Mar/Jun/Sep/Dec); NA otherwise. Available ~2008 onwards. |
Construction Note
IXI is constructed from FactSet fund-level holdings data on WRDS and Morningstar benchmark assignments covering 460+ equity indices (S&P, Russell, MSCI, CRSP, and sector indices). Each fund's holdings are weighted by one minus its Active Share so a fund that perfectly replicates its benchmark counts as fully passive, while a genuinely active fund with Active Share 0.6 contributes only 40% of its holdings. Stock-level IXI is the sum of these adjusted holdings divided by FactSet shares outstanding. The family decomposition groups 570+ benchmarks into six families based on prospectus-declared benchmark names. See Behmaram and Davis (2026) for full construction details.
Citation
If you use the IXI data, please cite the source paper:
Behmaram, Pouya, and Carter Davis (2026). "Indexing and the Elasticity of Stock Demand." Working Paper.
SSRN: https://ssrn.com/abstract=4823976BibTeX
@article{behmaram2026indexing,
  title={Indexing and the Elasticity of Stock Demand},
  author={Behmaram, Pouya and Davis, Carter},
  journal={Available at SSRN 4823976},
  year={2026}
}
The IXI panel data is currently available by request. To obtain access, please send an email describing your intended use.
Request Data Access